There are hundreds of ways to create customer experience diagrams and maps that are scattered throughout hundreds of different manuals and guides. Jim Kalbach has put them all together in a great, practical book, The Customer Path, which is a must-have for anyone involved in UX design, product or service creation, and their own business.
In this piece we’ll talk about the timing maps that will help you turn valuable customer insights into actionable ideas for growing your company and increasing profits.
Between Two Fires
The company whose example is given at the beginning of this article was known for its frequent mailing of incorrect invoices. And it was often difficult for customers to deal with this problem. Naturally, the first thing they did was to call the support hotline, but the operators were not authorized to handle account issues. Then customers would go to the sales representatives working with them, but they were not responsible for billing problems either. And pretty soon, customers were trapped in a vicious circle, unable to resolve the problem properly.
And then things got even worse. The collection department didn’t suspend the pre-scheduled non-payment notices. What’s more, this department didn’t even know if customers had objections to incorrect billing. As a result, customers, already frustrated by their unsuccessful attempts to resolve the problem caused by the company’s actions, in addition received a late payment notice from the company as well. This not only exacerbated the problem, but also made it much more difficult to resolve: there were now three or four parties involved, and customers were caught between two fires. Situations like this arise quite often and there is nothing surprising about such stories.
Very often in large organizations, one hand does not know what the other hand is doing.
Sync maps
Sync maps are categories of diagrams that help visually map a person’s user experience to an organization’s activities. Examples of synchronization maps include customer journey maps, service blueprints, user experience maps, and mental model diagrams. Many examples can be found throughout the book.
Sync maps turn the abstract into the concrete.
Sync maps have many advantages: when done properly, they create empathy by shifting the vision from the former “inside-out” to the new “outside-in”; sync maps give teams the big picture; creating user experience maps helps break down barriers within the organization; visualization helps organizations stay focused; sync maps point to opportunities for improvement and innovation; sync maps also have significant longevity.
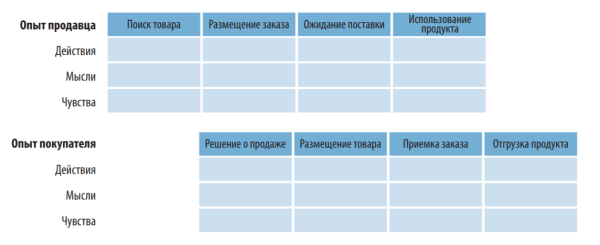
To synchronize the experiences of multiple actors, you can create separate but linked charts and show them together
Finally, synchronization maps are not limited to the world of commerce: they can be applied to a wide range of situations where user experience insights are required. Sync maps are at the heart of business, but they don’t provide direct answers or solutions, but rather stimulate communication and lead to deep insights. As business sophistication grows, these approaches have already become must-have tools for organizations to learn about the user experience they create with their work.
The benefits of working with synchronization maps
Your ultimate goal is to create an inclusive dialogue within your organization, not a diagram per se. From this perspective, experience mapping has many potential benefits.
Sync maps help you think more seriously about consumer interests
It’s surprising how little organizations sometimes know about the real user experience of the people they serve. Sync maps help shed light on the conditions in which people live in the real world. In doing so, they not only teach empathy to the organization’s employees, but more importantly, they stimulate action to address each person’s needs.
Timing cards enable you to see the “big picture”
Diagrams and maps serve as a common reference point to help arrive at a consensus.
In this sense, they can be considered strategic tools because they influence decision-making at all levels and lead to greater consistency in action. Diagrams help to solve the problem of so-called synchronization exhaustion, i.e. the tendency of people to get out of sync with each other.

Timing cards vary in structure. A chronological chart is the most common
A visual model captures an idea and “freezes” it in time
Creating a visual model together allows you to depict and capture synchronization in a diagram. Your thoughts, opinions and points of view will change, but the diagram will remain the same. With it, you add another additional constraint to your idea – and with it, the ability to visually visualize how the product vision changes. Sync maps provide a kind of conceptual “scaffolding” that allows organizations to scale their service. What’s more, maps also help maintain the big picture even as employees change.
Team members may come and go, but the charts ensure continuity.
Sync maps help break down boundaries between departments
People perceive a product or service as a single entity. Ideal solutions can easily cross internal organizational boundaries. Diagrams that illustrate the user experience picture usually reveal elements of the organization that hinder unity. Discussing these issues provides an opportunity to increase collaboration between different departments.
Warning: synchronization maps often reveal an uncomfortable truth.
Breaking down boundaries between departments is rarely easy. Employees may resist being pointed out to them about their shortcomings or white spots in their work. Synchronization begins by first identifying inconsistencies and then convincing others to accept the situation, guided not so much by your own benefit as by the customer’s benefit. In large enterprises, looking at things from the perspective of the user rather than the functional departments is critical to creating a great customer experience.
Synchronization maps allow you to achieve the desired concentration
Based on a 2001 study by Booz and Company, the majority of the 1,800 executives surveyed said they were unable to focus on their business strategy: they are constantly being “pulled” in completely different directions. As a result, many companies lack coherence. To unlock the full benefits of alignment, you need to take some deliberate steps – rethink your current strategy, overcome the traditional division between inward and outward-focused activities, and focus on your organization.

Maps arranged in a hierarchical manner eliminate the dimension associated with time. This is good in cases where many aspects arise simultaneously and it is difficult to show them in chronological order
Synchronization maps represent just such a conscious step: they inherently allow the two perspectives (“inward” and “outward”) to be juxtaposed. In doing so, they help organizations to gain proper focus on the main issues and coherence.
Timing maps help identify opportunities
Visualization allows for immediate insight and for seeing previously unseen opportunities for value creation. Although diagrams themselves do not provide immediate solutions, their presentation to the team often leads to insights. They clearly show the areas where improvements can be made: it’s about operational efficiency and design.
Timing maps are durable
Creating user experience maps can be considered a foundational activity of the company. Because synchronization maps reveal fundamental human needs and emotions, their data rarely changes. Completed charts retain their shape for years. From this perspective, mapping is best thought of as an investment with permanent and long-term benefits, rather than a one-time project level activity.

The network structure allows you to see the web of relationships between different aspects of the user experience that are neither chronological nor hierarchical
Synchronization maps are not limited to commercial relationships
The word ‘experience’ in its broadest sense reflects the human condition as a whole, not just the result of users’ relationship with the service provider. And although this book is characterized mainly by a commercial context, mapping techniques can be used in a wide range of situations – in the social sphere, government analysis, design training, urban planning and environmental protection. The possibilities of this tool are limitless.
Principles of synchronization
Here are a few rules to keep in mind
1. Show the big picture
Synch maps focus on human behavior as part
of
a larger ecosystem. They have nothing to do with product research. As much as possible, strive to study what people do, think, and feel in a given context.
2. use multiple dimensions
Synchronization maps illustrate many aspects of information at once. This is why there is the word “synchronization” in the name of the technique. The most frequent aspects on the user side include actions, thoughts, feelings, states of mind, goals, and pain points. On the organizational side, typical elements include processes, actions, goals, and indicators, as well as actors or their roles.
3. Show how value is exchanged
Synchronization maps allow you to see the points of contact and their context. They provide an opportunity to combine multiple layers of information to demonstrate the mechanisms of value exchange. As a result, synchronization maps allow the prediction of real user experience. They enable you to easily and leisurely go through all the touch points and analyze the broader range of circumstances around each of them.
4. Visualize the experience
Sync maps show a complete picture of the user experience in graphical form. Their strength lies in their ability to directly visualize everything at once. A ten-page report or slides with lists of ideas containing exactly the same information will not have the same impact. Visualization turns abstract and invisible concepts like “user experience” into something more tangible.
5. Make the result obvious
Synchronization maps should require little or no explanation. Participants need to navigate relatively quickly while learning them. Remember that a visual format alone does not guarantee simplicity: you will still have to work hard to reduce the amount of information to a few clear and short points.
6. Make sure the map is relevant to the purpose of the organization
Synchronization maps need to fit the needs of the organization. As the map creator, you should do your research, understand the goals, challenges, and future plans of the organization.
7. Do the research
The roots of synchronization maps lie in research. Creating them requires contact with people in the real world, research and observation.
About the book The Customer Way
Customers get frustrated – it happens a lot. It’s much worse when the people inside the companies creating the product don’t see it because they’re too focused on business processes. This practical book will show your company how to turn valuable customer observations into actionable insights. You’ll be able to visualize your customer experience and envision future solutions.
Product and brand managers, marketing professionals, and business owners will learn how mapping the customer experience will help identify where their business goals and customer perspectives intersect. Once you’re armed with this data, you’ll be able to deliver real value to users.
The book is divided into three parts in which you will:
– Understand the basic principles of charting and learn how these charts can be used in development strategy
.
– Learn how to create diagrams with four iterative modes in the user experience mapping process: creating the mapping initiative, exploring the experience, visualizing the process, and using the diagrams in workshops and experiments.
– Learn how to view key diagrams in action, including service plans, user journey maps, experience maps, mental models, and spatial and ecosystem maps.
Few organizations consciously want to make a bad impression on the customers they serve. However, it happens in their work on a regular basis.
Increasingly, people are choosing goods and services based on their own experiences and impressions. And to meet market expectations, companies must conduct their business by learning from their customers’ experiences. This book will highlight such opportunities.
The material is based on the book “The customer journey”.
The post Timing cards as a tool to create value appeared first on Business.